Every chart on this site is built from candlesticks, and every candlestick is just four numbers wearing a costume. If charts have ever looked like a secret language to you, this is the page that hands you the dictionary: one candle at a time, no background assumed.
By the end you will be able to look at any candle on any chart — Bitcoin or otherwise — and say exactly what happened inside it. That is a smaller promise than most chart guides make, and it is the only one that is entirely true.
One candle, four prices
Pick any stretch of time — say, one hour. Trading happens constantly inside that hour, at many prices. A candle compresses the whole hour into four facts: the price when the hour opened, the highest price anyone paid during it, the lowest, and the price when it closed. Open, high, low, close. Everything a candle shows is those four numbers; everything it hides is every price in between.
A tiny example makes it permanent. Suppose the hour opens at $100, excitement pushes trading up to $108, nerves drag it down to $97, and the hour ends calmly at $105. The candle for that hour must somehow say 100, 108, 97, 105. The next two sections are the costume it wears to do it.
Body and wicks: the anatomy
The thick part of the candle is the body, and it spans exactly two of the four numbers: the open and the close. A tall body means the period ended far from where it began — a decisive hour. A short body means price travelled and came back, or barely travelled at all.
The thin lines sticking out of the body are the wicks — also called shadows. The top of the upper wick is the high; the bottom of the lower wick is the low. Wicks are the record of rejection: a long upper wick says price visited higher ground and was not allowed to stay; a long lower wick says the same about the depths. When you read a candle, read it as a sentence: the body tells you where the argument ended, the wicks tell you where it raged.
Green and red: direction, not quality
Colour answers one question only: did the period close above or below where it opened? Above — the candle is drawn green (sometimes white or hollow, on other platforms). Below — red (sometimes black or filled). In our example hour, the close of $105 beat the open of $100, so the candle is green, its body running from 100 up to 105, with wicks reaching to 108 and 97.
Resist the instinct to read green as "good" and red as "bad." A green candle can end a day that terrified everyone holding the asset that morning; a red one can be a healthy pause in a rising month. Colour is grammar, not judgement. (If you use other apps, check their settings — a few flip or restyle the colours, which is exactly why the underlying rule, close versus open, is the thing worth remembering.)
The timeframe: one candle can be a minute or a month
Here is the part beginners are rarely told plainly: a candle has no natural size. The same chart can draw one candle per minute, per hour, per day, per month — the timeframe is a choice the viewer makes, and the chart redraws completely around it. The candle in our example covered an hour. Set the chart to daily and each candle covers a whole day of opens, highs, lows and closes; the hour we dissected becomes an invisible detail inside one day-candle’s wick.
This is why two honest people can look at "the Bitcoin chart" and describe opposite situations: they are looking at different timeframes. Whenever someone shows you a chart, the first question is not what it shows. It is: how much time is each candle? Our longer chart guide covers choosing timeframes on purpose.
From single candles to shapes people name
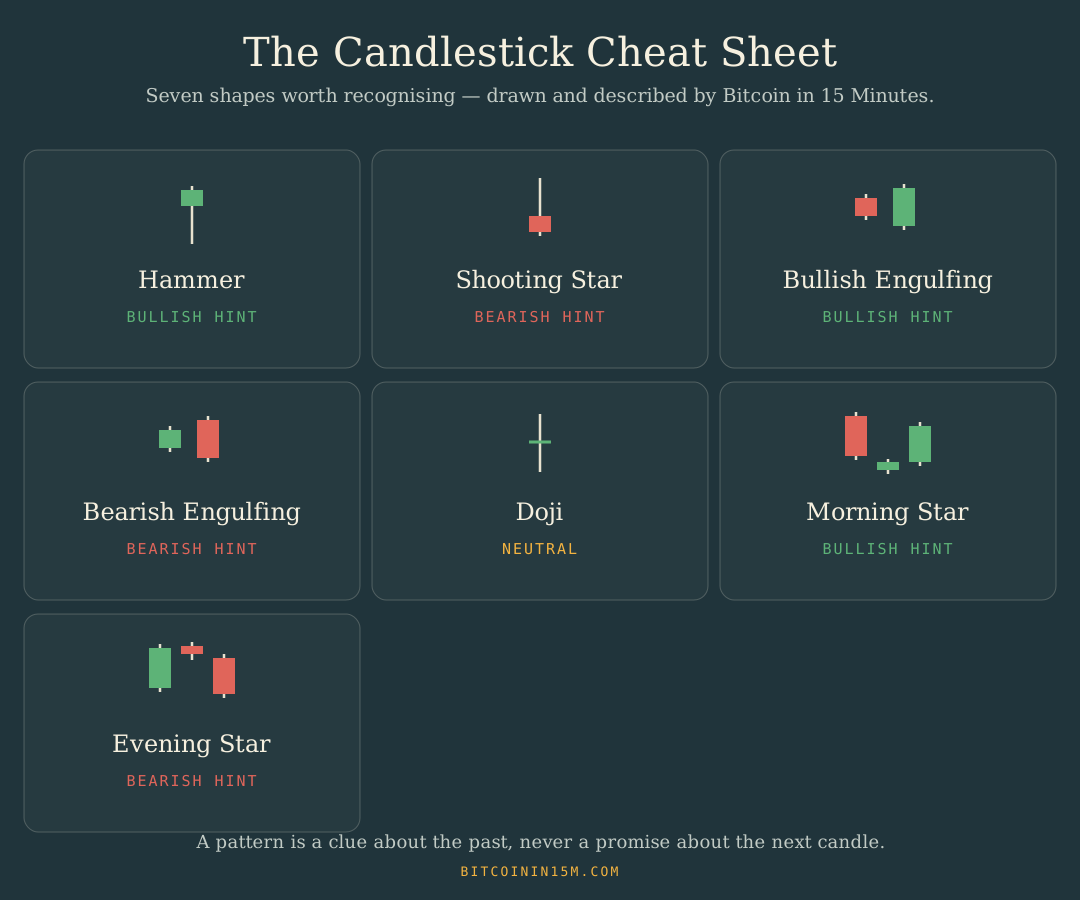
Read enough candles side by side and shapes recur: a small body stranded on a long tail; one candle swallowing the one before it; three candles that look like a sunrise. Traders over the centuries have named these patterns and attached readings to them — who was winning, who tired first. The seven best-known are drawn below, in our own cheat sheet: what each looks like, and how it is usually read.
Keep hold of the grammar you have just learned while you browse them. Every pattern is nothing more than opens, closes, highs and lows arranged in a memorable order — the names are shorthand for the four-price stories you can now read without them.
Hammer
Bullish hint
What it looks like. A small body perched at the top of a long lower tail, like a hammer hanging by its handle.
How it is usually read. Shows up after a fall: sellers dragged the price down, and buyers dragged most of it back before the period closed. Watched as a sign the fall may be tiring.
Shooting Star
Bearish hint
What it looks like. A small body sitting at the bottom under a long upper tail — the star shot up and fell back.
How it is usually read. Shows up after a rise: buyers reached for higher prices and got pushed back down. Watched as a sign the climb may be running out of believers.
Bullish Engulfing
Bullish hint
What it looks like. A modest red candle completely swallowed by the taller green candle that follows it.
How it is usually read. Sellers owned the first period; buyers took the second and then some. Watched as a change of hands — the crowd that was leaving started arriving.
Bearish Engulfing
Bearish hint
What it looks like. A modest green candle completely swallowed by the taller red candle that follows it.
How it is usually read. The mirror image: buyers owned the first period, sellers took the second outright. Watched as enthusiasm meeting an exit door.
Doji
Neutral
What it looks like. Open and close finish in almost the same place, so the body shrinks to a line between two wicks.
How it is usually read. A tug-of-war that ended in a draw. On its own a doji reports indecision — it becomes interesting only when it appears after a strong run in either direction.
Morning Star
Bullish hint
What it looks like. Three candles: a long red one, a small quiet one stranded at the bottom, then a long green one climbing back.
How it is usually read. Named for dawn after a dark night. The small middle candle is the pause where selling ran dry; the third is buyers returning in size.
Evening Star
Bearish hint
What it looks like. Three candles: a long green one, a small quiet one stranded at the top, then a long red one falling back.
How it is usually read. The morning star at dusk. The pause at the top is buying running dry; the third candle is sellers returning in size.
Patterns are descriptions, not instructions from the market. They summarise what buyers and sellers already did; the next candle is written by people who have not acted yet, and it owes the pattern nothing. Studies of pattern trading have never found the reliable fortune-telling the chart books promise — what they have found is that patterns are excellent vocabulary.
So use them the way you would use weather words. "It poured yesterday" is true, useful, and no guarantee about today. A reader who can name what happened, in the past tense, without sliding into prophecy, reads charts better than most people selling chart advice.
Four prices, a body, two wicks, a colour, a timeframe. That is the entire machine — everything else in chart reading is these parts, combined and named. The candles on the home page are yours to practise on.
Written by Robert King for Bitcoin in 15 Minutes. Educational only — not financial advice. Spotted an error? Tell me and I will fix it.