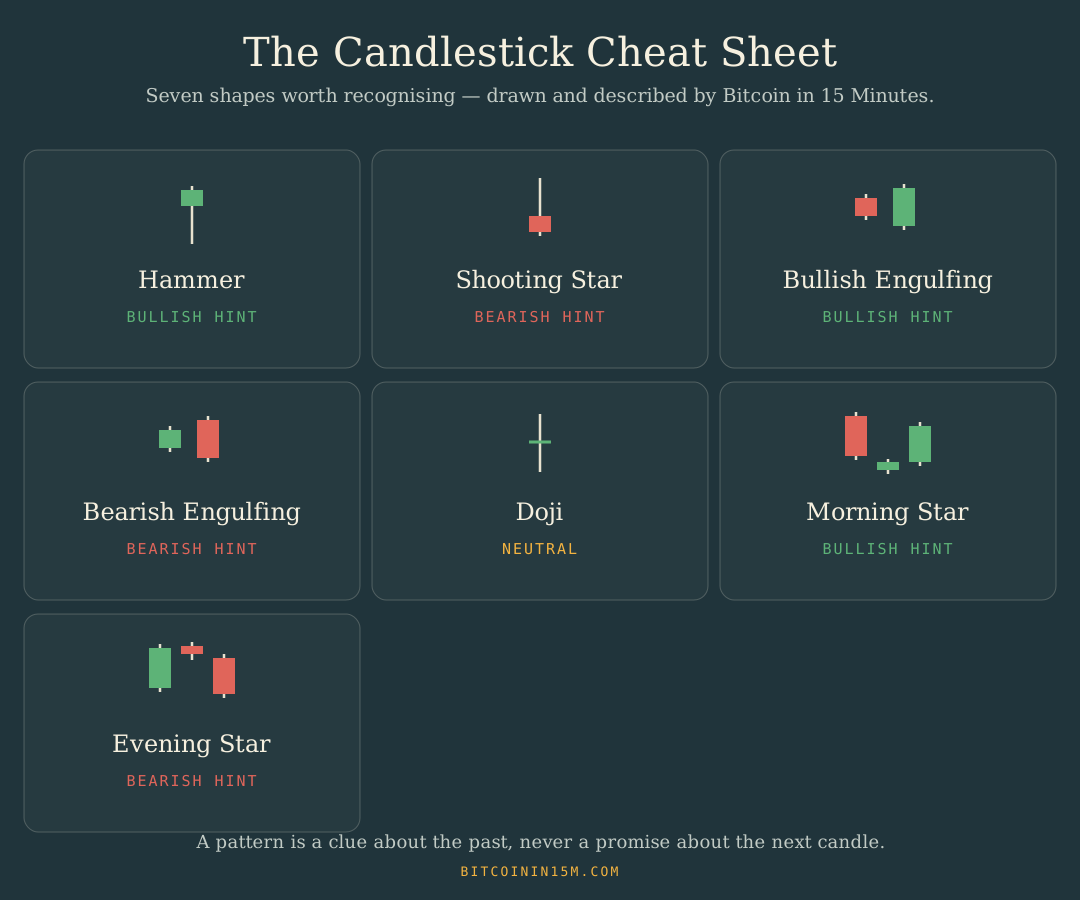
Candlestick traders have spent centuries naming the shapes candles make. The names are standard knowledge; the drawings and descriptions below are this site’s own, written the way we would want them explained to us. Keep this page beside the home page chart — or save the one-page version linked under the sheet — and use it to name what you are looking at.
One rule before the shapes: a pattern describes who pushed harder during periods that have already ended. It is a clue, watched by many traders, and sometimes the watching itself moves behaviour — but no shape obliges the next candle to do anything. Read every “hint” below with that sentence in mind.
Hammer
Bullish hint
What it looks like. A small body perched at the top of a long lower tail, like a hammer hanging by its handle.
How it is usually read. Shows up after a fall: sellers dragged the price down, and buyers dragged most of it back before the period closed. Watched as a sign the fall may be tiring.
Shooting Star
Bearish hint
What it looks like. A small body sitting at the bottom under a long upper tail — the star shot up and fell back.
How it is usually read. Shows up after a rise: buyers reached for higher prices and got pushed back down. Watched as a sign the climb may be running out of believers.
Bullish Engulfing
Bullish hint
What it looks like. A modest red candle completely swallowed by the taller green candle that follows it.
How it is usually read. Sellers owned the first period; buyers took the second and then some. Watched as a change of hands — the crowd that was leaving started arriving.
Bearish Engulfing
Bearish hint
What it looks like. A modest green candle completely swallowed by the taller red candle that follows it.
How it is usually read. The mirror image: buyers owned the first period, sellers took the second outright. Watched as enthusiasm meeting an exit door.
Doji
Neutral
What it looks like. Open and close finish in almost the same place, so the body shrinks to a line between two wicks.
How it is usually read. A tug-of-war that ended in a draw. On its own a doji reports indecision — it becomes interesting only when it appears after a strong run in either direction.
Morning Star
Bullish hint
What it looks like. Three candles: a long red one, a small quiet one stranded at the bottom, then a long green one climbing back.
How it is usually read. Named for dawn after a dark night. The small middle candle is the pause where selling ran dry; the third is buyers returning in size.
Evening Star
Bearish hint
What it looks like. Three candles: a long green one, a small quiet one stranded at the top, then a long red one falling back.
How it is usually read. The morning star at dusk. The pause at the top is buying running dry; the third candle is sellers returning in size.
New to candles altogether? Start with the chart lesson on the home page, then the chart guide, which covers timeframes, volume, and why the honest tense for charts is the past.